Use spectrum-signal analysis to limit RF power and spurious noise emissions
In the realm of RF power measurements, frequency domain analysis is one of the most fundamental techniques used with spectrum and vector signal analyzers. These instruments must adhere to specific standards regarding power transmission and parasitic noise emissions, while also employing proper measurement methodologies to ensure accuracy and minimize errors.
Several critical controls influence the outcome of frequency-based measurements, including the frequency range, center frequency, resolution bandwidth (RBW), and measurement time. The frequency range represents the total span of frequencies that the analyzer can capture, while the center frequency marks the midpoint of this range. It's important to note that these settings directly impact the front panel configuration of the instrument. Depending on the size of the frequency range, FFT-based signal analyzers operate in two distinct acquisition modes.
For frequency ranges up to the RBW, the analyzer downconverts a segment of the frequency spectrum before digitizing it. When the frequency range exceeds the RBW, the spectrum is processed sequentially. The RBW determines the frequency resolution along the axis, and traditionally, this was achieved using analog filters. However, modern FFT-based analyzers use digital processing and windowing functions to control spectral leakage and enhance resolution in smaller frequency bands.
This shift brings up an interesting question: how does the RBW relate to the FFT tap width? Table 1 illustrates the relationship between the RBW resolution parameters (at 3dB and 6dB) in a new RF signal analyzer and the corresponding FFT tap widths.
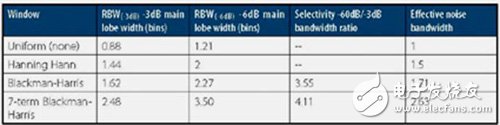
**Table 1:** RBW Frequency Resolution vs. FFT Tap Width
FFT-based analyzers offer window selection options to reduce spectral leakage and improve resolution in narrow frequency bands. Unlike traditional analyzers, which rely on analog filters, these systems use digital signal processing. As a result, when the RBW decreases, the measurement time increases due to longer acquisitions and more complex computations. However, with faster DSP processors, modern analyzers can perform high-resolution measurements efficiently.
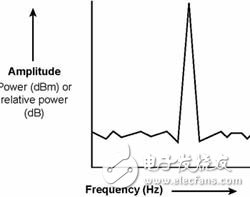
**Figure 1:** Relationship Between Frequency and Amplitude in Spectrum Analyzer Measurements
Amplitude settings play a crucial role in measurement accuracy as well. Parameters such as reference level, attenuator settings, and detection modes all influence the results. The reference level defines the maximum input range for the analyzer, similar to "volts/div" on an oscilloscope. It should be set just above the expected maximum signal level to avoid distortion or loss of sensitivity.
The optimal reference level balances between minimizing distortion and maintaining a low noise floor. In some cases, a lower reference level may be beneficial for wideband noise measurements, even if it introduces minor distortion. This trade-off can sometimes improve sensitivity if the distortion is identifiable and excluded from the final result.
Attenuator settings also affect the input range of the instrument. Typically, these are set automatically by the software based on the reference level. Some virtual instruments allow independent scaling of the Y-axis without affecting the actual amplitude settings, offering greater flexibility in visual interpretation.
Detection modes, such as normal, peak, or negative peak, determine how the analyzer processes spectral data. While traditional scanning analyzers use these modes, FFT-based analyzers do not. Detection mode affects how spectral information is compressed and displayed, especially when the number of data points exceeds the display’s capacity. This can impact total power measurements.
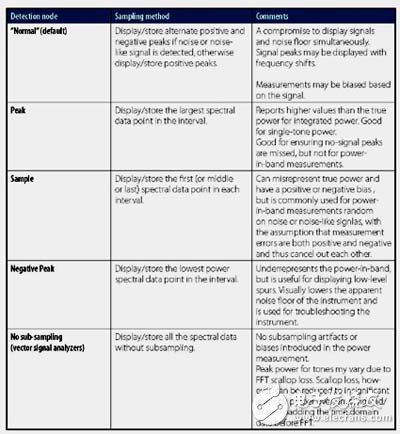
**Table 2:** Measurement Modes Affecting Power Measurement Results
Accuracy in spectrum analysis depends on several factors. Traditional analyzers rely on analog ramp signals for frequency sweeps, which can introduce errors related to the reference frequency, frequency range, and RBW. In contrast, FFT-based analyzers eliminate these analog limitations, allowing for consistent accuracy across the entire measurement range.
While frequency errors in traditional analyzers can be as high as 5% of the range or 15% of the RBW, FFT-based systems typically have errors ranging from 10% to 50% of the RBW, depending on the algorithm used. To compare these errors fairly, it's essential to consider the reference frequency error, which can be compensated using precision sources.
When using smaller RBW values, measurement time increases due to longer scan times. However, advanced FFT algorithms, such as those using interpolation, can achieve higher resolution than the RBW allows. For instance, setting the RBW to 2 kHz can significantly improve measurement accuracy.
Modern FFT-based analyzers can perform accurate measurements even at high RBW settings, enabling faster and more precise results within the same test duration. Some signal analyzers can process samples in under 20ms, making them six times faster than traditional spectrum analyzers.
Unless the correct measurement setup is used, results can vary significantly, even with the same instrument. Therefore, a thorough understanding of the underlying principles is essential for properly configuring and using these tools.
Ceramic Parts,Advanced 95 Ceramic Materials,High Strength Ceramics,Durable Ceramic Components
Yixing Guanming Special Ceramic Technology Co., Ltd , https://www.guanmingceramic.com