With the clinical application of electrocardiogram technology and the development of electronic technology, electrocardiography, as a more mature and widely used technology in biomedical measurement, has gradually become a routine clinical examination method, and has been used in the diagnosis, monitoring and Pharmacodynamic analysis plays a very important role. At present, the commonly used ECG detection circuits are mostly powered by dual power supplies. This solution requires many power supply devices and a large area of ​​layout and wiring, which will increase the cost of the product. The basic architecture of the ECG signal acquisition system is shown in Figure 1. The electrocardiogram signal of the human body is sent from the human body to the system through the electrodes and special lead wires. Through the filtering and amplification adjustment circuit, the weak ECG signal is amplified to an appropriate amplitude and is within the A / D conversion range. The control and data processing of the system is completed by ADI MCU ADuC7020 based on ARM7 TDMI core. This chip has a wealth of on-chip peripheral circuits, processing speed up to 40MIPS, A / D conversion speed up to 1MSPS, has a high cost performance. Finally, the results are sent from the ADuC7020 to the computer through the UART port, and the computer displays the results intuitively or stores them through the interface written by LabVIEW. Figure 2 is a basic hardware circuit diagram. The ECG signal first passes through a two-stage RC low-pass filter circuit and enters the buffer stage. Before the signal enters the system, high-frequency components need to be removed, so a low-pass filter with a cut-off frequency of 300 Hz is designed here to ensure that the weak ECG signal of 0.05 to 75 Hz will not be attenuated. The buffer stage consists of a voltage follower, which can increase the input impedance of the entire amplifier circuit and reduce the output impedance. In order to ensure the consistency of the differential signal, the amplifier integrated on the chip should be selected. The matched resistance network usually adopts the Wilson electrical center terminal network, which obtains the Wilson electrical center terminal through a specific resistance network as a reference point of the entire ECG system. The front stage of the filter amplifier circuit uses a negative feedback differential amplifier circuit. Here, the AD8221 instrument amplifier with adjustable gain and high common mode rejection ratio of ADI is used as the front stage amplifier. The magnification is set to 8 times, which is calculated by the formula G = 49.4kΩ / RG + 1, where RG is the resistance value between the two RG pins of the AD8221. This resistor should use high precision, low temperature drift metal film resistors to ensure the low noise performance of the AD8221. The REF pin of the AD8221 is not grounded, but forms a negative feedback loop with a low-pass filter to effectively filter out the DC component, so that the voltage at U1 is always clamped at 1.25V. Because it is powered by a single power supply, and the ECG signal voltage of different leads has positive and negative, it is necessary to provide a suitable clamping voltage. The voltage input range of the ADuC7020 in the AD conversion mode is 0-2.5V. Here, the intermediate value of 1.25V is selected as the clamping voltage. The amplitude of the single-ended signal output by the AD8221 is very small, and there is still a lot of interference in it, which makes it impossible to process data. The post-stage filter amplifier circuit is composed of an active low-pass with a large gain, and the gain is adjustable. Different people's ECG signal strength is different, considering the attenuation, the gain is generally set to 150 times. The transfer function of the system is: From the two aspects of protecting the patient and improving the common mode rejection ratio of the system, the common mode signal must be inverted and amplified before being fed back to the human body, so that the system and the human body together form a voltage parallel negative feedback network, commonly known as The right leg drive circuit. The ADuC7020 performs AD conversion on the processed ECG signal and selects the ADC sampling mode controlled by the timer. Once the A / D conversion is over, the ADC interrupt is triggered, and the digital signal is processed in the interrupt service routine. The key to processing ECG digital signals is the accurate identification of QRS complex waves in ECG signals. The width of the QRS complex of normal people is 0.06 to 0.10 seconds, and is not affected by changes in heart rhythm. In view of the very sharp characteristics of the R wave, we use a sliding time window to determine whether the signal peaks and valleys meet the requirements, and at the same time confirm whether it is within the time window. The double variable threshold method is used for the threshold of the signal amplitude, that is, the peak threshold and the valley threshold are set for the waveform. If the peak and valley thresholds change significantly within an appropriate period of time, reset the peak and valley thresholds. Below we will discuss QRS complex wave positioning and heart rhythm calculation. Only invert and filter the signal for the initial period of time. This is to recover the inverted ECG signal and avoid the initial signal fluctuations affecting the threshold. Then, within a certain period of time, the peak threshold Thpeak and the valley threshold THtrough are set according to the sampled data, and then the QRS wave is located. Finally, follow the steps below (see Figure 3) for data processing. Read the new sampling point Ni: With the R wave located, you can count the heart rate according to the following steps: 1) Find the first R wave and record the n value as peaktime1; 2) Find the second R wave and record the n value as peaktime2 ; 3) Calculate the heart rhythm according to the following formula.
The GFCI will not protect you from line contact hazards (i.e. a person holding two "hot" wires, a hot and a neutral wire in each hand, or contacting an overhead power line). However, it protects against the most common form of electrical shock hazard, the ground-fault. It also protects against fires, overheating, and destruction of wire insulation. Ground Fault Circuit Interrupter UL Ground Fault Circuit Interrupter UL,Auto-Monitoring Ground Fault Circuit Interrupters,Ground Fault Circuit Interrupter,Outlet Ground Fault Circuit Interrupter Hoojet Electric Appliance Co.,Ltd , https://www.hoojetgfci.com
The design given in this article uses a single power supply to solve the above problems and reduce product costs. At the same time, the design also uses a simple and practical algorithm in the embedded system based on the ARM core, which can quickly and accurately locate the QRS complex wave Heart rate). This design is designed for the majority of home users. It is small in size and only requires a personal computer to be connected to it to operate and observe ECG signals in real time. 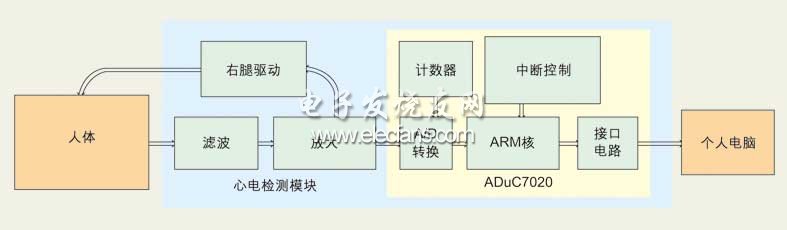
Figure 1: The basic architecture of the ECG signal acquisition system.
The amplitude of the ECG signal collected from the human body or the ECG signal generator is between 0.05 and 5 mV (generally 2 mV), and the frequency is between 0.05 Hz and 75 Hz. The ECG signal goes through several stages of circuits such as buffering, matching resistance network, voltage amplification and filtering. 
Figure 2: Basic hardware circuit. 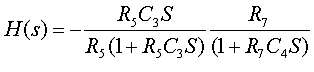
Both low-pass filters require low voltage offset, low temperature drift, and low noise. The AD8607 rail-to-rail input-output dual op amp from Analog Devices can meet these requirements well. Because the second-stage amplifier is the input of the inverting terminal, the resulting signal is inverted, which can be processed in software. 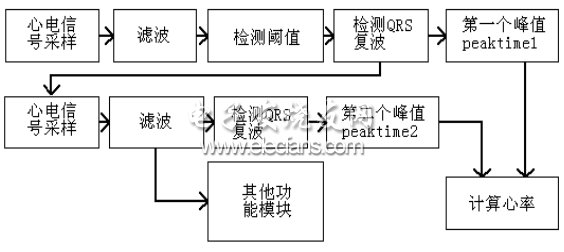
Figure 3: The basic steps of data processing.
1) Determine whether the amplitude of the sampled signal point is greater than the peak threshold Thpeak. If not satisfied, then return to step 1).
2) If the condition is met, start counting n = 1 and record the value of n as peakTIme1. Slide the start edge of the time window here.
3) Continue sampling Ni + 1, n + 1 for each sampling.
4) Determine whether the new sampling point Ni + 1 is less than the valley threshold. If not, return to step 4).
5) If the sampling point is less than the trough threshold Thtrough, then record the n value of the point as troughTIme1.
6 Judge whether the difference between troughTIme1 and peakTIme1 at the two signal points that meet the amplitude requirements is within the time window, that is, whether it is less than the window width THtime. If it is not less than THtime, then return to step 1).
7) If satisfied, this signal is considered to be a QRS complex. Peaktime1 is positioned as an R wave. 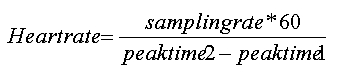
Practice has proved that the accuracy of the heart rhythm calculated by this algorithm is high, the calculation is simple and easy to implement, and finally the ECG signal waveform and heart rhythm value are observed on the PC.