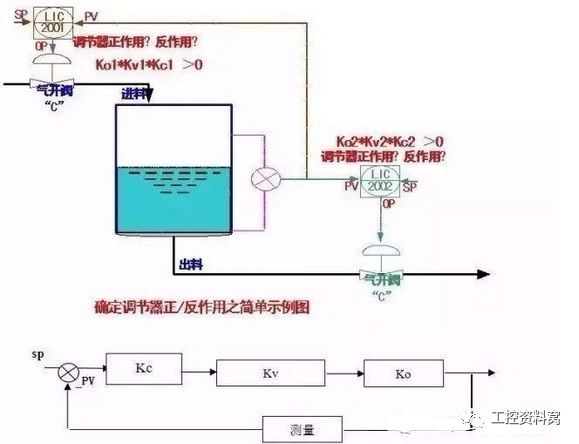
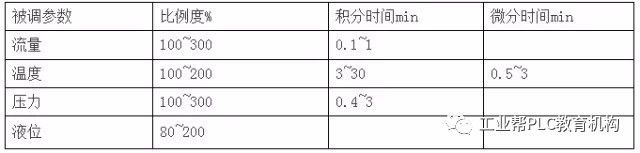
Method for Determining the Positive/Reverse Action of a Regulator Once the control strategy is defined and the regulator's positive or reverse action is determined, the next critical step is tuning the P, I, and D parameters. Based on years of field experience, adjusting these parameters requires careful consideration and understanding of the system. For detailed guidance, refer to the project documentation. Before starting the tuning process, ensure that the closed-loop system uses negative feedback, meaning that Ko * Kv * Kc > 0. This is essential for stable and predictable system behavior. Understanding the Process Gain (Ko): When the valve and actuator open, and the measured PV increases, Ko is positive. Otherwise, it is negative. Valve Gain (Kv): If the valve opens when actuated (air-to-open or electric-to-open), then Kv is positive. If it closes (air-to-close or electric-to-close), then Kv is negative. The signs of Ko and Kv are determined by the process characteristics and safety requirements. Using Ko * Kv * Kc > 0, we can determine the sign of Kc, which defines whether the controller is in direct or reverse action. Controller Gain (Kc): If Kc > 0, the controller is in reverse action; if Kc < 0, it is in direct action. Ensure the software configuration is correct before commissioning and parameter tuning. It’s crucial to verify the controller's action before any testing begins. Before setting the P, I, and D parameters, make sure the measurement is accurate and the valve operates smoothly. During tuning, communicate with the operators and monitor the production status closely to maintain safe operations. When adjusting the PID parameters, start with the secondary loop first, then the primary loop. The secondary loop should be tuned more aggressively, while the primary loop is fine-tuned. On the CRT display, open the regulator screen, change the setpoint (SP) or output (OP), apply a step change allowed by the process, and observe the PV response. Adjust the parameters repeatedly until the system behaves smoothly. In practice, a first-order response is often achievable. Experience-Based PID Parameter Settings For fluid processes (gas or liquid), empirical PID settings are as follows. It’s best to configure them in the software before installation and fine-tune only if necessary: 1. Flow Control (F): Typically P = 120–200%, I = 50–100s, D = 0s; Anti-surge systems: P = 120–200%, I = 20–40s, D = 15–40s; 2. Pressure Regulation (P): Typically P = 120–180%, I = 50–100s, D = 0s; Venting systems: P = 80–160%, I = 20–60s, D = 15–40s; 3. Liquid Level Control (L): Large containers: P = 80–120%, I = 200–900s, D = 0s; Medium containers: P = 100–160%, I = 80–400s, D = 0s; Small containers: P = 120–300%, I = 60–200s, D = 0s; 4. Temperature Control (T): Typically P = 120–260%, I = 50–200s, D = 20–60s; These values are based on experience and may not be absolute. In real applications, issues like poor valve response or process non-linearity may require adjustments. Patient observation and iterative tuning are key. Ultimately, successful automation depends on flexible and responsive valves and actuators. In a cascade control system (e.g., two controllers), the inner loop acts as part of the main loop, always maintaining a positive gain. The resulting PID settings usually produce a first-order response, though theoretically, it may show second-order damping. Considerations for Automatic Loop Commissioning 1. Basic Principles: Ensure smooth operation during automatic mode, with no large fluctuations in key parameters. Auxiliary equipment such as pressure, level, and temperature should also remain stable to avoid disruptions. 2. Coordination with Process Operators: Commissioning the automatic loop is part of an automation project. Clearly explain the work to the operators and guide their cooperation. Discuss potential impacts and how to handle unexpected situations. Before the first run, ask the operators to stabilize the process conditions. 3. Specific Precautions for the Control System: (1) All automatic loops must be thoroughly tested before deployment. If field changes occur, double-check signal flow and logic. Pay attention to switching timing. Ensure that the loop has simple manual override logic so that errors can be quickly corrected. (2) When commissioning, start with a wider proportional band and longer integral time. Set output limits near the current value to minimize disturbances. After confirming correct behavior, gradually release the limits and fine-tune the parameters based on performance. PID Parameter Tuning Methods 1. Basic Knowledge In an automatic control system, E = SP - PV. E is the deviation, SP is the setpoint, and PV is the measured value. A positive deviation occurs when SP > PV, and vice versa. 1) Proportional Action: The output is proportional to the deviation. At 100% proportionality, the output matches the deviation exactly. Lower proportionality increases the effect. Too much can cause oscillation, too little leads to slow response and overshoot. 2) Integral Action: Output is proportional to the integral of the deviation over time. It helps eliminate steady-state error. Too strong can cause oscillation, too weak leaves residual error. 3) Derivative Action: Output is proportional to the rate of change of the deviation. It helps anticipate changes and improve stability, especially in lagging systems. However, it cannot overcome pure delay. Suitable for temperature control. Too long a derivative time can cause instability. 2. Tuning Method Empirical tuning is the most common method for simple systems. It involves trial and error, starting with initial parameter settings based on the process and meter range. Larger ranges typically require stronger P settings. The critical proportional method involves putting the system into automatic mode with only proportional action. Maximize the integral time and set differential to zero. Gradually reduce the proportional band until equal amplitude oscillations occur. Record the proportional value (Pbc) and oscillation period (Tc). Calculate P = 2.2 * Pbc and T = 0.85 * Tc. Note that this method may not work well for systems with significant dead time. Rack Mount Battery,Home Energy Storage Battery,Residential Energy Storage Systems,Home Energy Storage Systems JIANGMEN RONDA LITHIUM BATTERY CO., LTD. , https://www.ronda-battery.com